Big Data Final Project
Team Member: Jessie Jin, Zhi Zhang, Xuexuan Wang, Jenny Zhou
As we are living in unprecedented times of pandemic, our team would like to put our efforts and contribute to battling COVID-19 health crisis. This project aims to help track and analyze the current COVID pandemic spread in NYC across the five boroughs: Manhattan, Queens, Brooklyn, and Staten Island. In addition, we included studies of relations between pandemic and its influential factors: age, income and traffic. Moreover, we analyzed impacted areas due to the burst of the virus: job market, business license application, certificate of occupancy issued for new buildings, public transportation, emergency notification for public health, hospital icu beds and permitted events. Based on current data, we forecasted the number of positive cases using machine learning algorithms.
Notice the below summary number might be slightly different to another tables and maps due to different update/analysis time.
update:
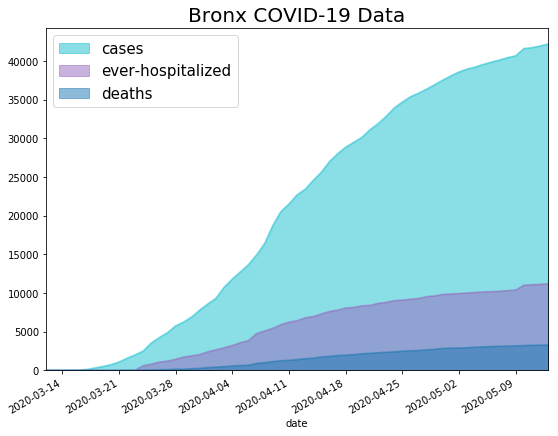
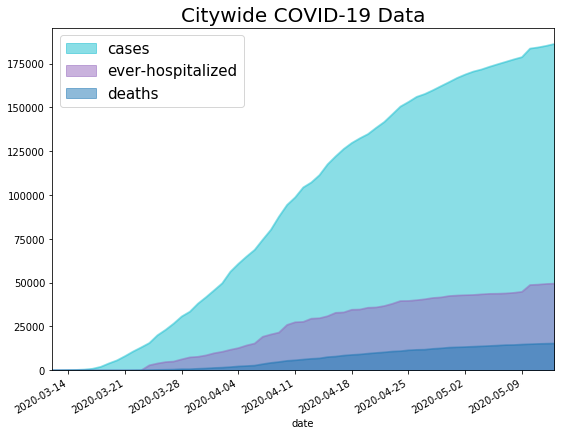
NYC COVID-19 cases, deaths and hosplitalized data for each borough
Update: 2020-05-14 (from 2020-03-12)
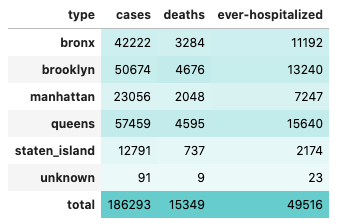
Cases, Deaths and Hosplitalized Data
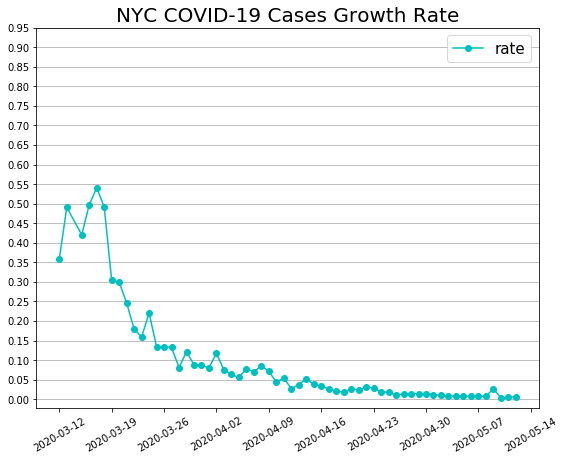
The Cases Growth Rate is getting lower than 5%.
This is case number distribution Map for each zipcode
Update: 2020-05-15 12:30PM (from 2020-03-12)
| Test: | - |
|---|---|
| Positives : | - |
| Positives Rate : | - |
| Population : | - |
| Annual Income: (2017) | |
| under $25k income: | - |
| $25k - 50k income: | - |
| $50k - 75k income: | - |
| $75k - 100k income: | - |
| $100k - 200k income: | - |
| above $200k income: | - |
Cases, Deaths and Hosplitalized Data for Each Borough
Update: 2020-05-14 (from 2020-03-12)
Click below buttons to check each borough data in Area chart.
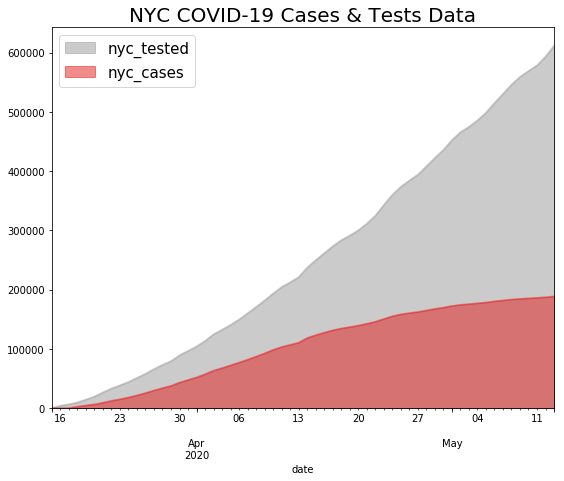
The number of tests is getting higher and the number of positive cases is flattening, which is good.
Update: 2020-05-14 (from 2020-03-12)
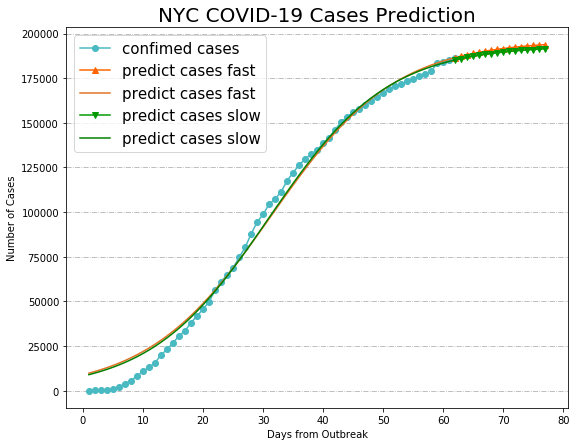
NYC COVID-19 cases prediction by logistic increase model with least squares approximation
Update: 2020-05-14 (from 2020-03-12)
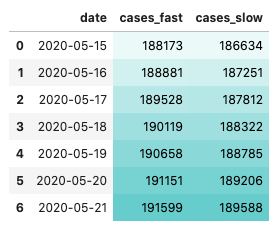
NYC COVID-19 Cases Prediction in A Week
We analyzed three factors that would affect the COVID-19 case:
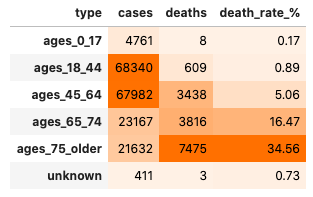
The chart below shows the relationship between COVID-19 case and age. Adult and middle-aged group has the highest case number. But the number of deaths and death rate are highest in senior citizens.
Update: 2020-05-13 (from 2020-03-12)
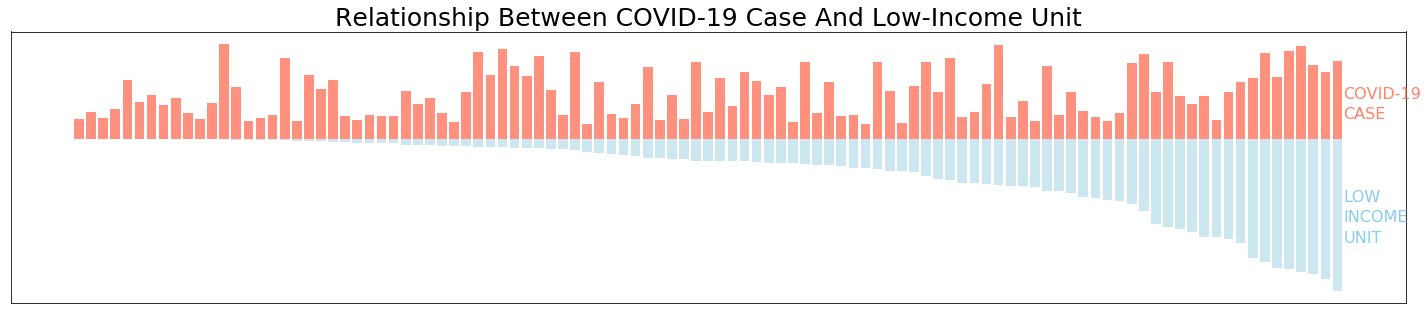
The chart below shows the relationship between COVID-19 case and income. The number of low-income units (blue part) gradually increases on the x-axis. The right part of the chart shows that COVID-19 cases (orange part) is also increasing with the increase of number of low-income units.
Update: 2020-05-13 (from 2020-03-12)
![]() |
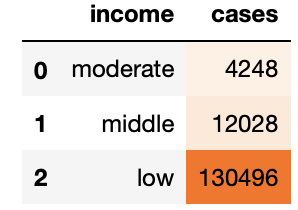
According to the income, we divide the data into three groups. The result shows that the COVID-19 cases from the low-income group is much more than the middle-income group and moderate-income group. |
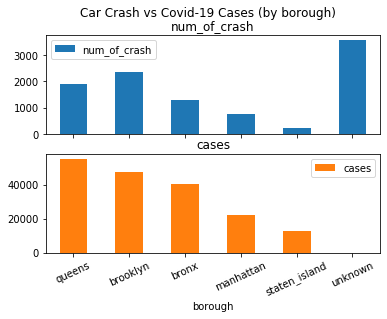
The bar graphs below show the number of car crashes and number of COVID-19 cases acrossing the five boroughs. Queens and Brooklyn have the highest number of infections also have the highest number of car crashes. Since data on nyc traffics are limited, number of car crashes is used to reflect the traffic. This shows that the areas where have more traffics tend to have more COVID-19 cases.
Update: 2020-05-13 (from 2020-03-12)
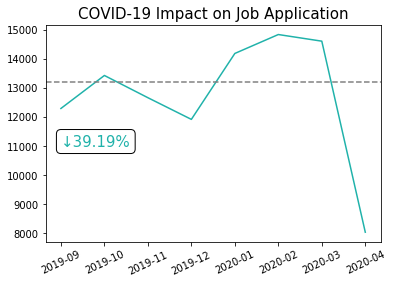
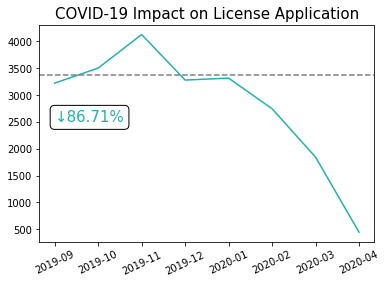
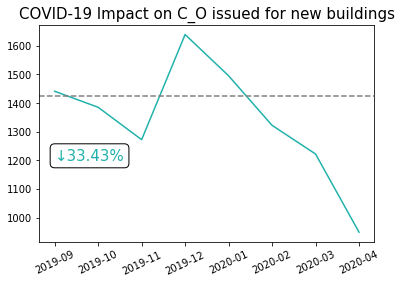
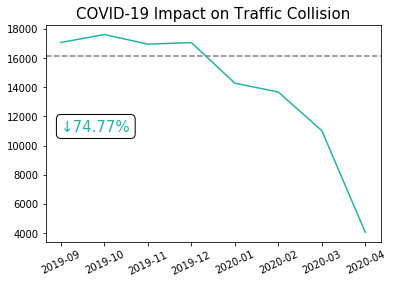
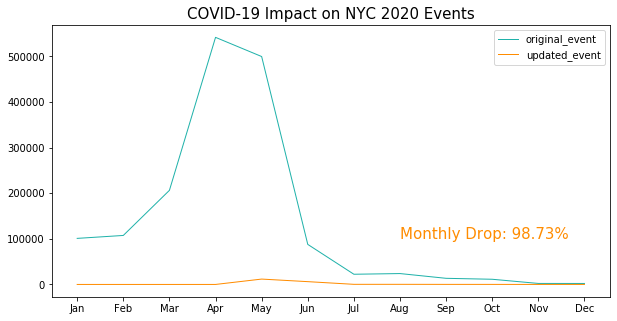
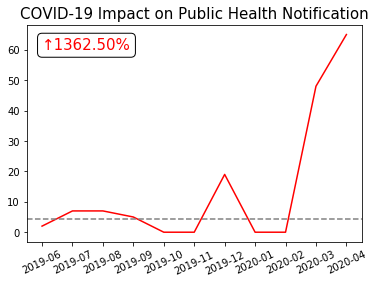
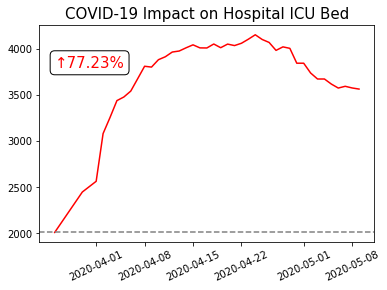
We analyzed COVID-19 Impacts on the job market, business license application, certificate of occupancy issued for new buildings, public transportation, emergency notification for public health, and permitted events.
Comparing with the 6-month average prior to pandemic, the results show that the following areas are declining:
Update: 2020-05-14 (from 2019-09-01)
![]() |
![]() |
![]() |
![]() |
Update: 2020-05-14 (from 2019-01-01)
On the other hand, the followings are increasing:
Update: 2020-05-13 (from 2019-06-01) Update: 2020-05-13 (from 2020-03-26)
![]() |
![]() |